Executive Summary
We are driven by a bold mission to achieve net zero by 2040. This ambitious goal encompasses all Scope 1 and 2 emissions, and we are committed to reducing Scope 3 emissions wherever possible. From the academic year 2022–23, we have reported our carbon emissions using the EAUC (Environmental Association for Universities and Colleges) Standardised Carbon Emissions Framework (SCEF) – wherever data availability permits.
Here outlines the full methodology used to calculate Imperial College London’s carbon emissions year-on-year.
The SCEF is based on the Greenhouse Gas Protocol and has been proposed as a new good practice voluntary standard for the Higher and Further Education sectors to report emissions from academic activities. It has broader coverage of Scope 3 than both the existing Higher Education Statistics Agency (HESA) reporting required for the Higher Education Sector and the Streamlined Energy and Carbon Reporting (SECR) reporting required for companies. The carbon emissions published in Imperial's Annual Financial Report used SECR and differ within Scope 1 and 2 from this report as SECR includes wider commercial activities, while SCEF focuses on only academic activities in those Scopes.
This report unveils a fascinating landscape of our carbon footprint. Using the EAUC SCEF, we have expanded our reporting to encompass previously unexplored areas, including staff homeworking and student travel, to provide a more holistic and detailed summary of our total carbon emissions. We have also revised our methodology for calculating emissions from spend data.
We will discuss the methodology and results for each category within the SCEF used to calculate Imperial's carbon emissions. Unless stated specifically, conversion factors (CF) have come from the UK Government GHG Conversion Factors for Company Reporting, compiled by the Department for Energy Security and Net Zero and the Department for Environment, Food, and Rural Affairs (DEFRA). All values have been rounded to two significant figures.
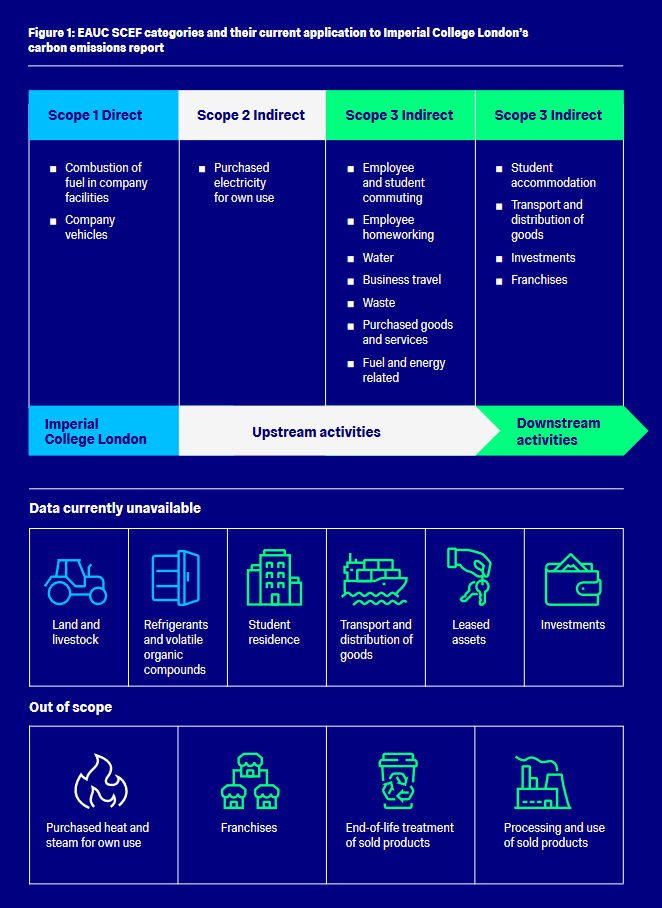 Figure 1: EAUC SCEF categories and their current application to Imperial’s carbon emissions reporting.
Intro
- BEIS – Department for Business, Energy and Industrial Strategy
- CHP – Combined heat and power unit
- CF – Conversion Factor(s)
- CO2e – Carbon Dioxide Equivalent
- DEFRA – Department for Environment, Food and Rural Affairs
- EAUC – Environmental Association for Universities and Colleges
- EMR – Estates Management Record
- FTE – Full-time equivalent
- GBP – Great British Pounds
- GHG – Greenhouse Gases
- HESA – Higher Education Statistics Agency
- HESCET – Higher Education Supply Chain Emissions Tool
- REGO – Renewable Energy Guarantees of Origin
- SCEF – Standardised Carbon Emissions Framework
- tCO2e – Tonnes of Carbon Dioxide Equivalent
- VOC – Volatile Organic Compounds
- WTT – Well-to-tank
- WTW – Well-to-wheel
Scope 1 and 2 emissions
Scope 1 emissions are our direct emissions as a result of sources we own and control. This is combustion of fuel in owned and controlled premises and emissions from owned land and livestock.
Scope 2 emissions are indirect emissions from the generation of grid-derived electricity and heat by utility providers. Imperial does not purchase heat or steam directly.
Scope 1 and 2
- Scope 1: Natural Gas
- Scope 1: Vehicle Fleet
- Scope 1: Other Fuels
- Scope 1: Data Currently Unavailable
- Scope 2: Purchased Electricity
Scope and Boundaries
The combustion of natural gas in on-site boilers and CHP in buildings that we operationally control. Buildings that are leased out or have a commercial arrangement with utilities included are not included in the scope. These reporting boundaries align to the Estates Management Record (EMR) from the Higher Education Statistics Agency (HESA).
Methodology
Advanced
We obtain natural gas for the CHP and gas boilers from the gas grid. Emissions are calculated by multiplying the consumption obtained from invoices by the financial year's CF for natural gas.
Data Sources
- Natural gas consumed in kWh.
- Financial year CF for ‘Natural Gas – Gross CV’ (kWh).
Scope and Boundaries
Since 22-23, Imperial's fleet consists of 30 vehicles operated by 15 departments, with five long-term leases and six electric vehicles. Scope 1 emissions from the fleet are determined using fuel records supplied by the finance team.
Methodology
Advanced
Emissions are calculated using fuel card records from the financial year which provides the fuel type and quantity purchases in litres. Litres of fuel is the multiplied by the relevant CF.
Data Sources
- Type of fuel consumed in litres.
- Financial year's CF for 'Diesel – average biofuel blend’ (litres) and ‘Petrol - average biofuel blend’ (litres).
Scope and Boundaries
The combustion of diesel or oil in owned and controlled premises such as on-site boilers or generators. The scope covers temporary boilers in South Kensington and Harlington.
Methodology
Advanced
Emissions have been calculated using expense data of procured fuel, providing the fuel type and litres purchased.
Data Sources
- Type of fuel purchased in litres.
- Relevant CF for ‘Biodiesel HVO’ (litres).
Refrigerants
Volatile Organic Compounds (VOCs)
We are investigating the possibilities within our procurement system to easily tag and track the purchase of VOCs for reporting.
Land and Livestock
Silwood Park Campus is 88ha of land, of which 73ha are classified as Parkland. In order to estimate our emissions from this area, further data on the species biodiversity and land type of the park would need to be gathered. Imperial does not own any livestock.
Scope and Boundaries
Emissions as a result of generation of grid-derived electricity we consume.
Methodology
Advanced
Location-based approach: Metering data was obtained from our supplier in kWh and converted into tCO2e using the relevant CF.
Market-based approach: Certificates were obtained from our supplier to reflect the emissions associated with the energy mix purchased.
Data Sources
- Electricity consumption in kWh.
- Relevant CF for ‘Electricity (UK)’ (kWh).
- REGO certification.
Scope 3 emissions
Scope 3 covers the widest range of emissions. It includes all indirect emissions from up and down the value chain, ranging from water and waste to staff commuting and business travel. Emission sources franchises and sold products are not applicable to Imperial.
Scope 3
- Procurement and Supply Chain
- Water
- Fuel and Energy
- Waste Disposal and Treatment
- Business Travel
- Staff Commuting
- Staff Homeworking
- Student Commuting
- Student Travel
- Data Currently Unavailable
Scope and Boundaries
Procurement and Supply Chain includes all upstream emissions as a result of goods and services purchased. This has previously been based on the HESCET (Higher Education Supply Chain Emissions Tool), a scope 3 emissions tool for the education sector developed by HEPA (Higher Education Procurement Association). HESCET typically includes emissions for business travel, utilities, and waste; we have calculated these separately using a consumption-based methodology as opposed to a spend-based methodology, and they are reported in their respective sections within Scope 3.
Methodology
The standard HESCET approach maps Imperial’s spend codes to the Procurement Higher Education (ProcHE) coding, which is then mapped to 311 standard categories set by Defra with known spend-based emissions factors. These 311 categories can be grouped in 12 high-level sectors. For this report, the HESCET mapping and categorisation was revised to ensure an accurate reporting of Scope 3 emissions. A full methodology can be found in the Appendix.
Data Sources
- Total expenditure in GBP.
- HESCET tool and associated CF.
- Revised CF from the UK Government GHG Emissions Conversion Factors; EPA GHG Emissions Factors; and EXIOBASE.
Scope and Boundaries
This includes the upstream emissions associated with all purchased water Imperial consumed. Buildings that are leased out or have a commercial arrangement with utilities included are not included in the scope. These reporting boundaries align to the EMR guidelines from HESA.
Methodology
Intermediate
Water data was obtained from the supplier in m3 and multiplied by the relevant CF.
Data Sources
- Water consumption in m3.
- Relevant CF for ‘Water supply’ (cubic metres).
Scope and Boundaries
This includes the upstream emissions as a result of fuel and energy consumption within Scope 1 and 2, such as transmission and transportation of fuel to the point of use.
Methodology
Advanced
Electricity and gas data obtained for Scope 1 and 2 were converted into tCO2e using relevant CF. For electricity, transmission, and distribution (T&D) CF are used which consider the emissions associated with grid losses. For fuels, which includes natural gas, well-to-tank (WTT) CF are used which calculates the emissions associated with extracting, refining, and transporting the raw fuel sources to our site.
Data Sources
- Gas consumption data in kWh obtained from supplier invoices.
- Electricity consumption data in kWh obtained from supplier invoices.
- Relevant CF for ‘Transmission and Distribution – UK Electricity’ (kWh) and WTT ‘Natural Gas – Gross CV’ (kWh).
Scope and Boundaries
The upstream emissions from disposing and treating waste, recycling, and wastewater.
Methodology
Waste and Recycling - Advanced
Imperial obtains tonnage data from our supplier which includes tonnage by material and treatment. Emissions are then calculated using CF which are both material and treatment specific.
Wastewater - Basic
Volume of water supplied was converted into tCO2e by assuming 95% of total water supplied was disposed of and treated and applying the national CF.
Data Sources
- Waste data in tonnes, split by material and treatment.
- RelevantCF from WRAP and the UK Government Environment Agency.
- Water consumption data in m3.
- Relevant CF for 'Water treatment’ (cubic metres).
Scope and Boundaries
The upstream emissions as a result of all travel undertaken by staff, students, and guests for business purposes.
Methodology
Air Travel and Rail Travel - Advanced
The majority of Imeprial’s air travel purchases are through our external supplier Egencia, who calculate emissions considering mileage, fuel consumptions, and class of travel. For the remaining emissions which are expensed, we have expense data. We use a conversion factor based off the total spend and total tCO2e emissions from Egencia to project total tCO2e from all air travel expenditure.
Taxi and Coaches - Basic
This includes taxis, coaches and vehicles with a hired driver. Expenditure in GBP was converted to tCO2e using the spend-based CF provided by the HESCET tool.
Hotels and Subsistence - Basic
This includes all meals expensed for business trips within our travel and expenses policies, as well as hotel stays. Expenditure in GBP was converted to tCO2e using the spend-based CF provided by the HESCET tool.
Car Hire - Basic
This includes all costs associated with car hire and leases. Expenditure in GBP was converted to tCO2e using the spend-based CF provided by the HESCET tool.
Grey Fleet - Basic
Grey fleet refers to all costs from vehicles owned and driven by employees for business purposes. It is recorded by mileage reclaimed. Expenditure in GBP was converted to tCO2e using the spend-based CF provided by the HESCET tool.
Data Sources
- Expenditure in GBP for business travel expenses.
- Spend-based CF from HESCET.
- Expenditure in GBP and emissions in tCO2e from Egencia.
Scope and Boundaries
The upstream emissions from employees travelling to and from work.
Methodology
Advanced
Results from a 2014-15 staff commuting survey were used which supplied mode of transport and distance travelled. 623 individuals answer the survey, or 7.5% of the staff population at the time. To this, we apply On Site full-time equivalent (FTE) for staff and relevant WTW CF.
Assumptions:
- Distances provided in the survey were for a round-trip.
- Survey results were applicable across the whole staff population.
- A standard 44-week work year, considering 3 weeks of university closure and 5 weeks of annual leave.
Data Sources
- 2014-15 staff survey results.
- Financial year staff statistics.
- Relevant CF for ‘WTW – Passenger Vehicles and Travel by Land’.
Scope and Boundaries
The upstream emissions from employees working from home during their contractual hours.
Methodology
Intermediate
Homeworking emissions are calculated using the basic methodology from the Homeworking Emissions Whitepaper produced by ecoact in partnership with Lloyds Banking Group and NatWest Group. This converts FTE into kWh, considering office equipment and heating energy. Relevant CF are then used to calculate tCO2e.
Data Sources
- Financial year staff statistics.
- Relevant CF for ‘UK Electricity’ (kWh).
Scope and Boundaries
The upstream emissions from students commuting to and from the university as required by the university.
Methodology
Intermediate
Results from the 2018-19 Student Experience Survey are used, which provides mode of transport; number of days travelled on to campus per week; and length of journey in minutes. From this, the distance of journeys could be estimated. 4876 students (3799 undergraduate and 1077 postgraduate) answered these questions, or 25% of the student population at the time. The survey was not open for final year undergraduate students who instead participate in the National Student Survey.
Several assumptions were made for the calculations:
- Undergraduates have a 31-week year with the summer, Christmas, and Easter holidays excluded.
- Taught postgraduates have a 44-week year with the Christmas and easter holidays excluded.
- Research postgraduates have a 47-week year with 5-weeks of annual leave.
- Student commuting habits have not significantly changed since 2018-19 and post-pandemic.
Data Sources
- 2018-19 Student Experience Survey results.
- Financial year student statistics.
- Relevant CF for ‘WTW – Passenger Vehicles and Travel by Land’.
Scope and Boundaries
The upstream emissions from students travelling between university and their family home annually.
Methodology
Intermediate
Data was taken from a 2022-23 departmental student survey which collected the number of trips people took home annually; the mode(s) of transport; and country of their destination. The survey received 122 responses, split between 75 undergraduates and 47 postgraduates. We focused solely on air and rail travel to calculate the emissions and placed an upper limit of five roundtrips annually.
Domestic Students
As destinations were collected as countries as opposed to postcodes, we assumed an average distance to the population centre of mass of the UK, which is Snarestone, Leicestershire. The frequency of trips was based on the survey results and extrapolated to the total 2022-23 domestic student population.
EU and Overseas Students
The air-line distance was mapped to the centre of each country from London as opposed to flight or rail routes. The distances are then used to calculate an average short-haul and average long-haul travel distance and applied to the 2022-23 EU and Overseas student population respectively. Mode and frequency of trips was based on the survey results. In this analysis, we assume responsibility for up to five return trips per year per student.
Data Sources
- 2022-23 departmental student travel survey.
- Financial year's student statistics.
- Relevant CF for ‘WTT - Flights’ and ‘WTT - Rail’ (km).
Capital Expenditure
Upstream emissions for capital expenditure have been included within Procurement and Supply Chain using spend-based CF.
Student Accommodation
Leased Buildings and Vehicles – Upstream
Leased Buildings and Vehicles – Downstream
Investments
Guidance on calculating downstream emissions from investments is currently limited and provided on a case-by-case basis. Calculating emissions for investments will be investigated when guidance is available.
Appendix:
Check out our full methodology for our Scope 3: Procurement and Supply Chain emissions
Last updated: October 2024