Chemical Engineering Department Air Travel Emissions Report 2022-23
Authors: The Chemical Engineering Sustainability Committee
Imperial has released a Sustainable Travel Policy to prioritise climate-conscious travel as the default approach. This means minimising emissions and maximising the value of essential trips through a focus on quality over quantity.
Imperial has committed to reduce air travel emissions by 25% by 2026 against the baseline year 2017–18 (tonnes of CO2-eq per person per year). Business travel makes up a significant portion of our travel emissions, and there is great potential to reduce these emissions.
The Chemical Engineering Department’s Sustainability Committee have analysed Departmental air travel emissions to quantify and communicate our carbon footprint from our activities, in line with Imperial’s new policy. The purpose of this report aims to inform our community about our travel activities and the environmental impact that arises from the way we travel, with the expectation that gradually, travel-conscious decisions become common practice.
Travel is classified as Scope 3 emissions which include all indirect environmental impacts arising from our operations.
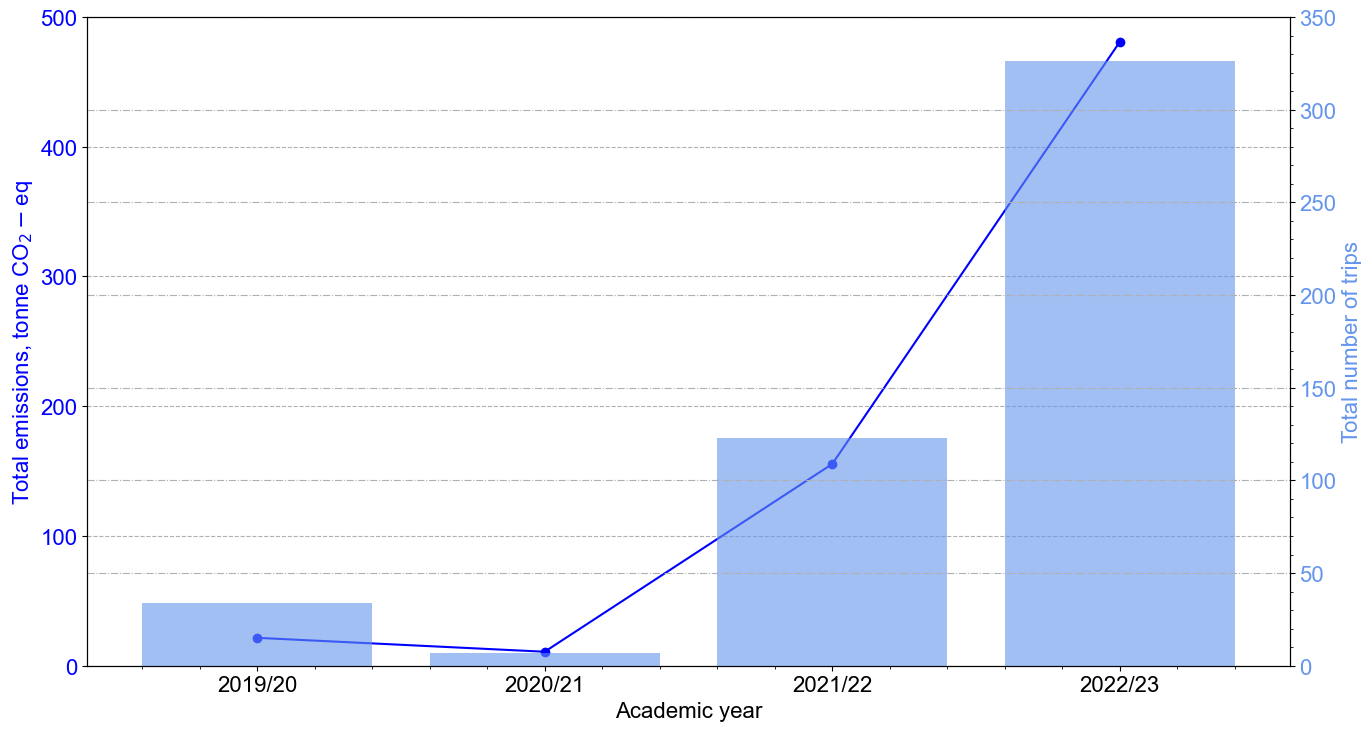
Total emissions (tonne CO2-eq): Represented by the line plot in blue, we observe a significant increase in emissions from 2019/20 to 2022/23. The rise in emissions correlates with the gradual return to pre-pandemic travel and academic/research activities which require air travel. In 2022/23, air travel emissions were close to 500 tonne CO2-eq.
Total number of trips: Shown by the bar chart in light blue, there is a noticeable increase in the number of flights over the years, particularly between 2021/22 and 2022/23. This increase is indicative of the resumption of international collaborations, conferences, and field research.
Looking at air travel habits over the last four years, the emissions per trip are as follows:
- 2019/20: 0.63 tonne CO₂-eq per trip
- 2020/21: 1.54 tonne CO₂-eq per trip
- 2021/22: 1.26 tonne CO₂-eq per trip
- 2022/23: 1.48 tonne CO₂-eq per trip
The average emissions per trip peaked in the 2020/21 academic year. This is likely due to a lower number of flights, resulting in higher average emissions per flight. Looking at the last three years, the average emissions per trip across the Department is 1.4 tonne CO₂-eq. However, this figure can vary depending on specific trips. These fluctuations highlight the impact of travel patterns and underscore the importance of optimizing travel routes and transport modes.
Emissions by cabin class
Cabin class affects the efficiency of air travel in terms of CO2-eq emissions per passenger kilometre. More airplane space for premium seating (First & Business Class) reduces the total number of passengers a plane can carry. This increases the average CO₂-eq emissions per passenger. There is no perfect way to account for this difference but the DESNZ methodology document on GHG conversion factors uses average seating configurations from airlines and aircraft manufacturers to estimate "scaling factors" for each class (see the document's Table 38). Long-haul flights have a wider variation in premium seating space compared to short-haul flights. The scaling factors adjust the average CO₂ emission based on class, lowering economy and raising business/first class emissions.
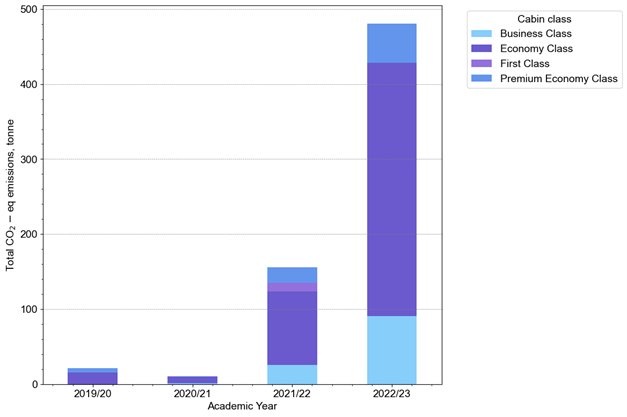
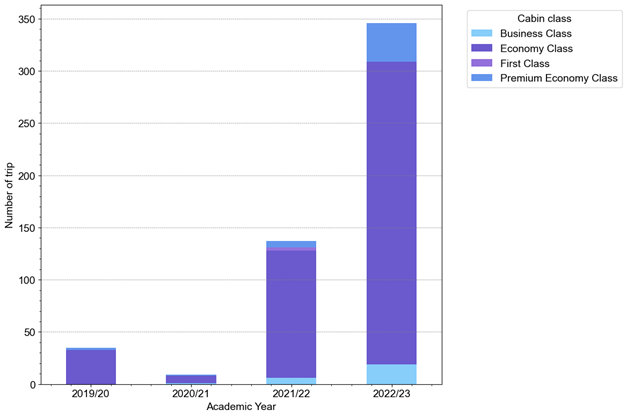
The distribution of emissions by cabin class varies by academic year, reflecting the changes in travel patterns and class preferences.
Economy Class dominates in terms of both emissions and number of flights across the academic years.
Premium Economy and Business Class have fewer flights but still contribute significantly to the total emissions due to higher emissions per flight.
First Class appears in 2021/22 with notable emissions despite having a small number of flights.
a) Total emissions
b) Per academic year, categorised by flight class
Emissions by distance
The figure below breaks down emissions from travel activities by domestic, short-haul, and long-haul flights, mirroring the DENSZ methodology. Notably, it reveals that long-haul flights contribute a significant share of these emissions.
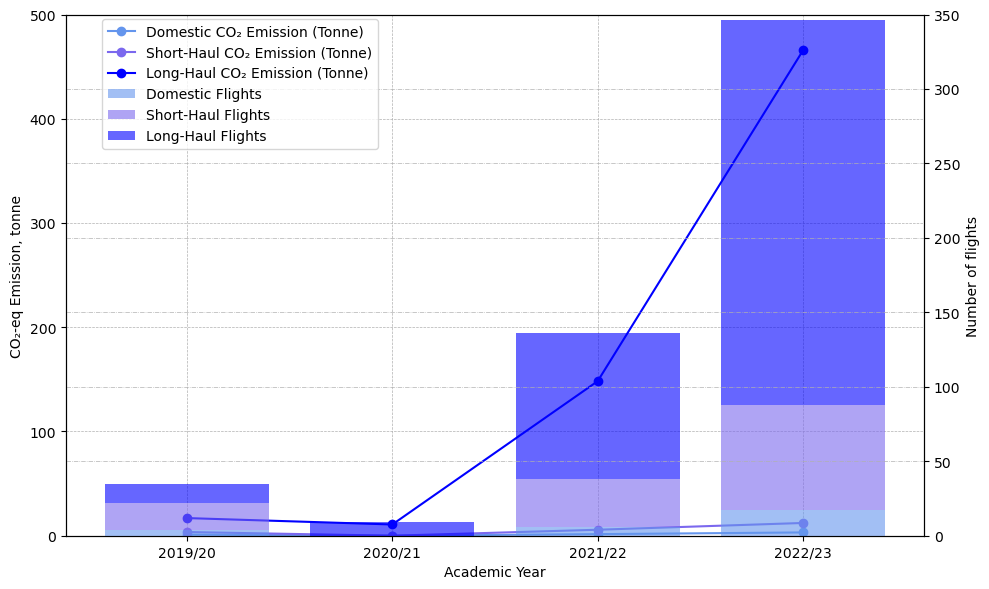
Domestic flights, operating entirely within the United Kingdom (including the Isle of Man and Channel Islands but excluding Gibraltar), are straightforward to classify. Following industry standards set by the Civil Aviation Authority and the International Air Transport Association, short-haul flights are generally considered those under 1,500 kilometres. Flights with a distance greater than or equal to 1500 km are considered as long-haul flights.
Long-haul flights contribute the largest share of emissions, accounting for around 70%. Short-haul and domestic flights make up the remaining portion. Shifting passengers from short-haul and domestic flights to train could lead to an estimated 3% reduction in emissions.
2022/23 Top-10 travel routes by CO2- eq emissions
The data highlights the most frequent travel destinations, which can help in understanding travel patterns and potential areas for emissions reduction.
Phoenix, US destination has the highest total CO2 emissions and the highest number of flights. This suggests frequent travel to Phoenix, due to a renowned international conference taking place in this location.
Kuala Lumpur, Malaysia’s emissions are quite high, despite having relatively fewer flights. This indicates that flights to Kuala Lumpur are likely long-haul, contributing to higher emissions per flight.
There is a noticeable variation in emissions relative to the number of flights. Some destinations like Phoenix have high emissions due to high travel frequency, while others like Kuala Lumpur have high emissions due to the long-haul nature of fewer flights.
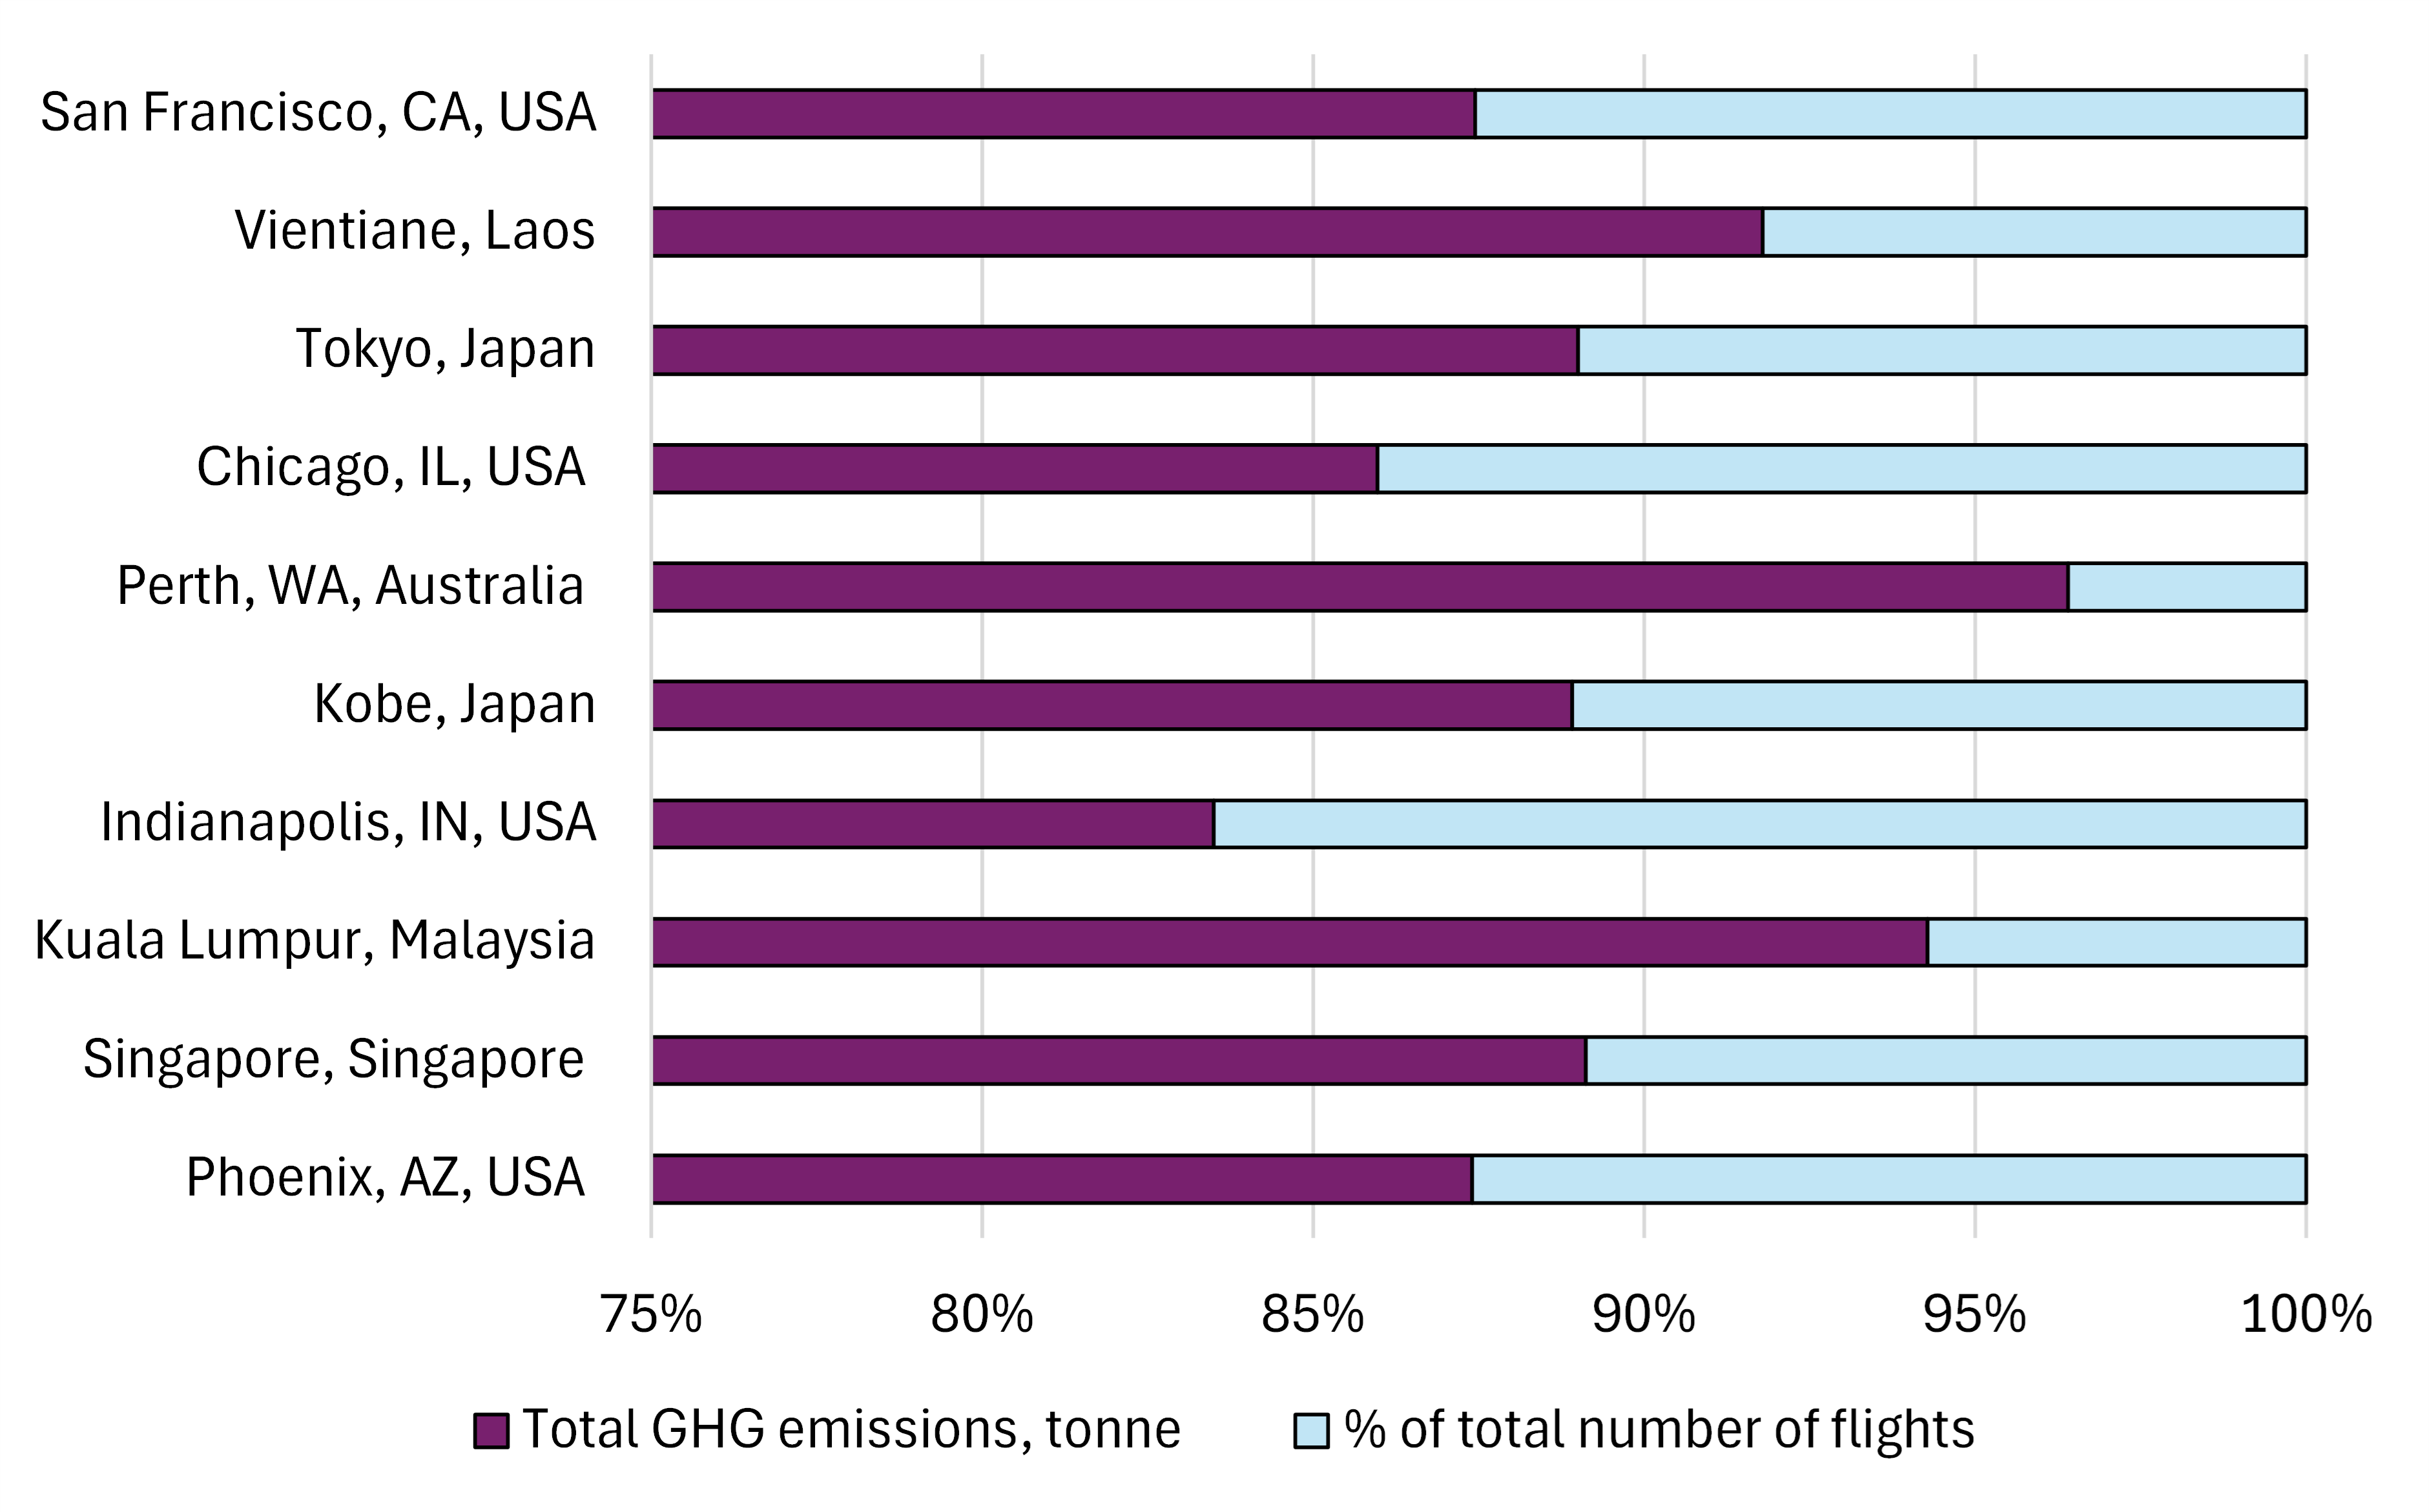
Top Travel Destination (2022/2023):
- Location: Phoenix, AZ, USA (PHX - Sky Harbor Intl. Airport)
- Number of Flights: 31
- Reason for Travel: AIChE Annual Meeting
Although the number of flights to Australia and Malaysia are fewer, their contributions to total GHG emissions are higher.
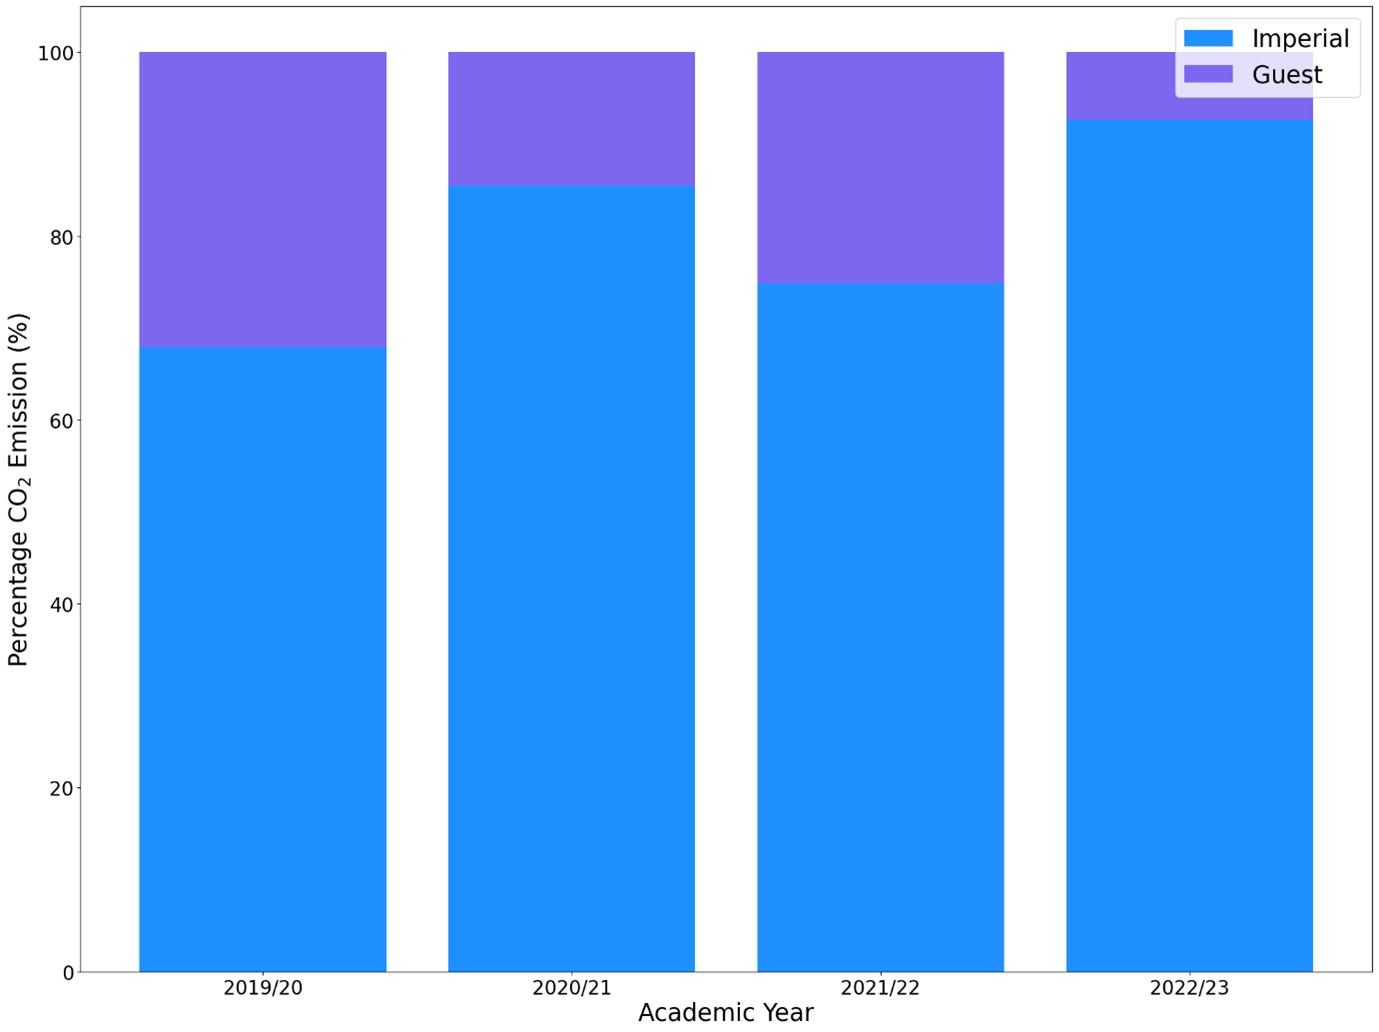
Emissions by traveller group
Emissions from Imperial staff and students' business travel are consistently higher than those from guest travel (visitors), although guest travel emissions can contribute up to 30% of total emissions, as seen in the 2019-2020 academic year.
Recommendations to reduce air travel emissions
The Sustainability Committee will work in collaboration with Imperial to look into practical and effective solutions to reduce air travel emissions. At present, the following points are what we recommend for our community to follow:
- Reassess the necessity of each trip and promote alternatives like virtual meetings, especially for internal and short-distance engagements.
- Encourage the use of trains or other lower-emission transportation modes for short to medium distances (five hours or less) instead of flights.
- Optimise travel routes to reduce the number of stops and layovers with longer stays and promote the use of direct flights when necessary. Consider booking your travel as early as possible to allow time to fully explore all travel options.
- For long-haul flights, travel in economy class and consider premium economy before requesting business class in the case of health and welfare reasons.
.png)